Challenge 2026

THOR × NeuroBench Challenge 2026

Advancing Brain-Computer Interfaces with Neuromorphic Systems: evaluating spike-based motor imagery decoders for absolute classification accuracy and compute efficiency.

Phase-I Completed March – August 2026 Online · Global Open Call $1,000 Edge AI Foundation Prize Pool

Inaugural Neuromorphic Benchmark Competition

Moving BCI decoders out of the lab and onto event-driven hardware

The THOR Neuromorphic Commons partnered with NeuroBench and the Edge AI Foundation to benchmark spiking neural network architectures on continuous EEG Motor Imagery (OpenBMI). Submissions were evaluated in two distinct tracks: maximum classification accuracy and energy-efficient synaptic operations.

Dataset

The OpenBMI EEG-MI Benchmark

A Brain-Computer Interface (BCI) translates neural activity into commands for external software or hardware. This challenge specifically targets the Motor Imagery (MI) paradigm.

Clinical Goal

Moving neural decoding technology out of bulky clinical setups into ultra-low-power wearable decoders for motorized wheelchairs and robotic prosthetics.

Societal Impact

Life-changing assistive potential for individuals living with stroke recovery, ALS, or spinal cord injuries.

The Dataset: OpenBMI

The OpenBMI dataset provides an unprecedented scale of high-quality EEG recordings, distinguishing it from smaller legacy datasets that suffer from severe overfitting.

  • 54 subjects across multiple recording sessions to explicitly benchmark session-to-session and subject-to-subject generalization.
  • 62-channel EEG Motor Imagery, capturing left vs. right hand imagined movements.
  • Includes verified “BCI illiteracy” samples to test algorithm resilience when subject response is weak or noisy.
  • Motor Cortex Subset: A focused 20-electrode subset spanning the motor cortex was preprocessed for the competition harness.

Reference Publication

Lee, Min-Ho, et al. “EEG dataset and OpenBMI toolbox for three BCI paradigms: An investigation into BCI illiteracy.” GigaScience 8.5 (2019): giz002.

Read paper in GigaScience
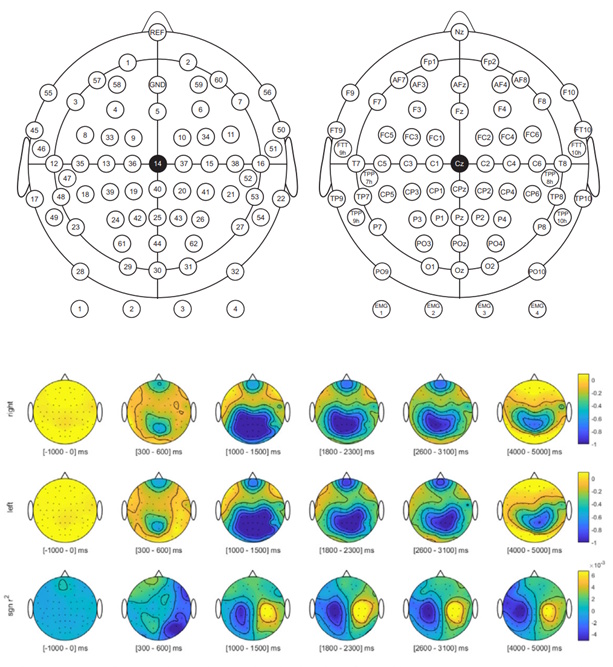
Visualization of OpenBMI EEG-MI dataset capture, probe placement, and activity heatmaps.
Figure 1 · Sensor montages, probe placement, and neural activity heatmaps from the OpenBMI Motor Imagery acquisition protocol.
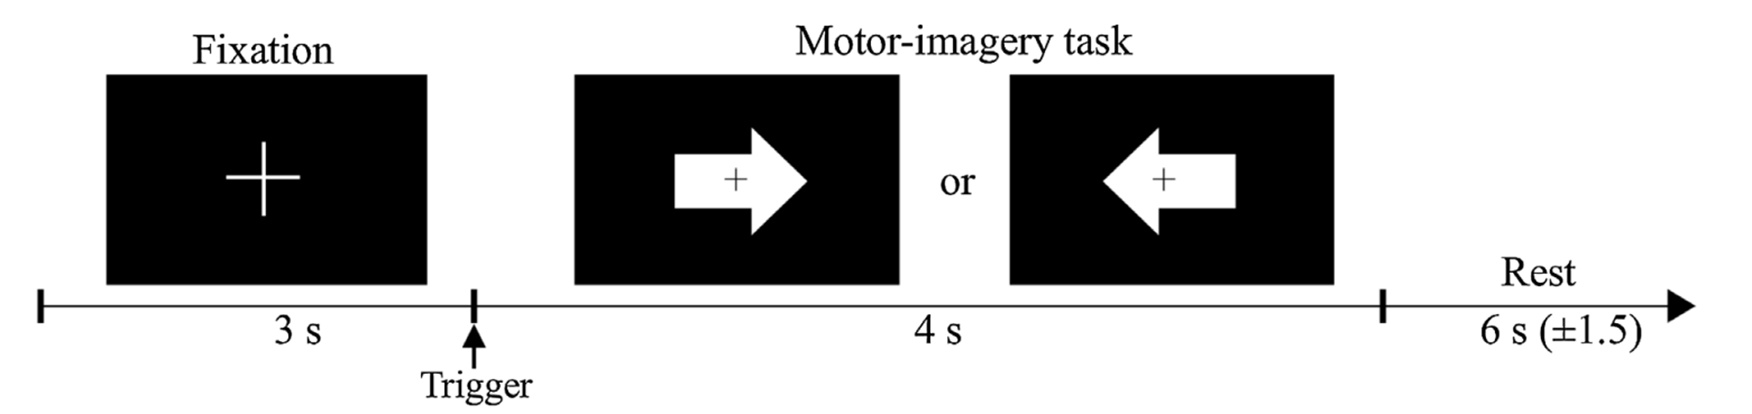
The experimental EEG-MI task flow.
Figure 2 · Online test paradigm: 3-second fixation cross followed by a 4-second active motor imagery task flanked by resting baselines.

Challenge Overview

Dual-Track Neuromorphic Evaluation

Standard deep neural networks ingest continuous, floating-point analog signals. Neuromorphic systems, however, operate on event-driven, asynchronous binary spikes. Models must convert continuous amplitudes into discrete spike trains to classify left-hand vs. right-hand motor imagery.

Track 1 Classification

Absolute Accuracy

Measures the baseline capability of the neuromorphic model to accurately classify left-hand versus right-hand motor imagery across the cross-validation splits, independent of compute cost or model footprint.

  • Strict multi-phase cross-validation strategy testing generalization across subjects.
  • Ranked strictly on the single highest test accuracy achieved by each team.
  • Unlimited submission attempts without penalty.

Track 2 Efficiency

Compute Efficiency

Rather than dense Multiply-Accumulates (MACs), the NeuroBench harness measures effective Synaptic Operations (SynOps = MACs + 0.1 · ACs) triggered by sparse spike trains, paired with memory footprint (weights & state).

  • Rewards event-driven sparsity: fewer spikes directly translate to microjoule savings on THOR hardware.
  • Evaluated via two transparent scoring methodologies: NES (log-penalty) and NBS (savings geometric mean).
  • Identifies submissions on the non-dominated Pareto front (accuracy vs. compute vs. memory).

Open Participation Criteria

Participation was open globally to all academic institutions, universities, research laboratories, and industry groups. To ensure complete integrity, organizing chairs and directly affiliated research staff were strictly prohibited from submitting entries.

Instructions

Harness & Participation Toolkit

Official repositories, datasets, instructions, and submission documentation provided to all challenge participants.

Resource

Register for the Challenge

Sign up to participate in the THOR NeuroBench Challenge 2026.

Resource

Challenge Instructions

Detailed guidelines and rules for the challenge.

Resource

Code Harness GitHub

Instructions for the NeuroBench Code Harness with examples.

Resource

Download OpenBMI Dataset

Preprocessed Dataset for OpenBMI Challenge : EEG-MI Task.

Resource

Submit Solution

Upload your model code securely.

Resource

Leaderboard & Results

View real-time rankings and evaluation results.

Timeline

Challenge Schedule

Milestones from official announcement to Phase-I leaderboard release and future Phase-II invitations.

23 February 2026 completed

Challenge Phase-I Announcement

Official launch of Phase-I of the THOR x Neurobench Challenge, for developing neuromorphic spiking algorithms.

24 March 2026 completed

Phase-I Dataset Release & Challenge Details

Release of the openBMI EEG-MI dataset and detailed specifications for the Phase-I challenge, focusing on efficient neuromorphic algorithm development.

25 March 2026 completed

Registration Opens

Registration opens for participants interested in tackling the BCI challenge with neuromorphic spiking algorithms.

10 June 2026 completed

Phase-I Submissions Open

The portal for submitting neuromorphic spiking algorithm solutions for Phase-I of the challenge becomes active.

05 August 2026 completed

Phase-I Submission Deadline

Final deadline for all Phase-I submissions of neuromorphic spiking algorithms for the EEG-MI task.

16 September 2026 pending

Phase-I Results Announced

Announcement of top-performing neuromorphic algorithms from Phase-I

30 September 2026 pending

Phase-II Invitations

Extending invitations for the advanced Phase-II.

2026-2027 tbd

Challenge Phase-II

The second phase of the challenge, focusing on further refinement and deployment of neuromorphic spiking algorithms for BCI applications.

Leaderboard

Official Results & Rankings

Final competition standings across Track 1 (Absolute Accuracy) and Track 2 (Compute Efficiency). All submissions evaluated on the unified NeuroBench EEG-MI test harness.

Track 1

Absolute Accuracy

Ranked purely on the highest reported test accuracy, independent of model size, compute, or memory footprint. A team's result is its single best submission. There is no penalty for the number of attempts.

Submission Accuracy Over Time

Each point represents one submission, plotted by date against verified test accuracy.

Scatter Plot

Track 1 Standings & Submission Log

Teams ranked by top submission. Click any expandable row to inspect that team's iterative submissions.

Sorted by Accuracy
Track 2

Compute Efficiency

Ranks the trade-off between accuracy, compute (effective MACs + effective ACs), and memory footprint. Two independent scoring strategies were developed and are both reported below for complete transparency.

Evaluation Strategy 1 · Recommended

NeuroEfficiency Score (NES)

NES = Accuracy − λ · log₁₀(R), where R = √[(W / OPS_REF) · (Footprint / FP_REF)]

Accuracy minus a log-penalty for compute + footprint, self-normalized per submission without pool distortion.

Mathematical Formulation

  1. 1. Weighted ops combine MACs and ACs: W = Effective MACs + α · Effective ACs, with α = 0.1. An accumulate is treated as roughly a tenth the cost of a multiply-accumulate, folding both compute types into one MAC-equivalent cost figure.
  2. 2. Resource blends compute and memory on a log scale: R = √[(W / OPS_REF) · (Footprint / FP_REF)]. The geometric mean gives one decade of footprint the same weight as one decade of compute, preventing winning by optimizing only one axis.
  3. 3. No submission-pool normalization: Unlike min/max scoring, every term depends only on the submission's own numbers. OPS_REF and FP_REF are fixed constants, so no team can move another team's score by submitting an extreme outlier.
  4. 4. NES: explicit accuracy-for-resources exchange rate: NES = Accuracy − λ · log₁₀(R), with λ = 0.05. A 10× increase in resources must be repaid with at least 5.0 accuracy points. The ranking is robust across λ ∈ [0.03, 0.07].
  5. 5. Team score = best submission, Pareto front reported as cross-check: A team's result is the maximum NES across all submissions (no penalty for attempts). Submissions are flagged if they sit on the accuracy/ops/footprint Pareto front as an independent sanity check.

Accuracy vs. Weighted Ops

Log-scaled x-axis. Ringed points sit on the non-dominated Pareto front.

Best NES Score per Team

Each team's single highest-scoring submission under Strategy 1.

Strategy 1 Results (NES)

Click any team with multiple submissions to expand full submission records.

Ranked by NES
Evaluation Strategy 2 · Pool-Relative

Normalized Balanced Score (NBS)

Final Score = Accuracy × Model Efficiency, where Model Efficiency = Ops Savings^0.5 · Footprint Savings^0.5

Accuracy × Savings Score, normalized against the pool, but mathematically sensitive to pool outliers.

Mathematical Formulation

  1. 1. Total Weighted Ops: W = Effective MACs + α · Effective ACs, with α = 0.1.
  2. 2. Ops Savings: log-ratio against observed pool: Ops Savings = 1 − [log₁₀(W) − log₁₀(W_min)] / [log₁₀(W_max) − log₁₀(W_min)], normalized across all submitted rows.
  3. 3. Footprint Savings: log-ratio across best-per-team: Footprint normalized against min/max taken only from each team's highest-accuracy submission.
  4. 4. Model Efficiency: geometric mean: Model Efficiency = Ops Savings^0.5 · Footprint Savings^0.5, balancing compute and memory savings.
  5. 5. Final Score: Final Score = Accuracy × Model Efficiency. Best score across submissions wins.
Methodology Note Known limitations of pool-relative normalization:
  • Both Ops Savings and Footprint Savings are min/max-normalized against the pool. A single near-zero-cost outlier submission drags the log-min toward −∞, compressing everyone else's savings toward zero.
  • Ops Savings and Footprint Savings use two different populations for their min/max (all rows vs. best-per-team), introducing asymmetry.
  • These mathematical vulnerabilities motivated the NeuroEfficiency Score (NES, Strategy 1), which scores every submission independently.

Accuracy vs. Memory Footprint

Log-scaled x-axis showing memory footprint in bytes vs. test accuracy.

Best NBS per Team

Each team's highest-scoring submission under Strategy 2.

Strategy 2 Results (NBS)

Click any team to expand all submission records.

Ranked by Final Score

Awards

Awards & Prize Pool

Recognizing breakthroughs in brain-computer interfaces with neuromorphic computing, generously sponsored by the Edge AI Foundation.

Track 1 Winner

$500

Absolute Accuracy Champion

Awarded to the top-ranking submission for absolute classification accuracy on the OpenBMI EEG-MI benchmark test splits.

Winning Team EdgeSynapse AI Johannes Kepler University Linz, Austria (73.38%)
Track 2 Winner

$500

Compute Efficiency Champion

Awarded to the top-performing submission optimizing the joint Pareto frontier of high classification accuracy, sparse synaptic operations, and tiny memory footprint.

Winning Team PHC Lab National Yang Ming Chiao Tung University, Taiwan (NES: 0.627)

People & Partners

Organizers & Sponsors

The steering committee and partner organizations behind the THOR x NeuroBench Challenge 2026.

Tej Pandit

Tej Pandit

THOR Lead Engineer

University of Texas at San Antonio

Jason Yik

Jason Yik

NeuroBench Lead

Harvard University

Benedetto Leto

Benedetto Leto

NeuroBench Challenge Co-Lead

Politecnico di Torino